1. Introduction
Encouraged by the interesting set of papers/interviews on Agro-Homeopathy in the December 2008 issue, I have sorted out some material on the geomagnetic sensitivity of plants from the past and added some measurements on plants and their interactions with homeopathic potencies. The title I have chosen for this is exemplified by the voltage waveforms of the sensitive plant Mimosa pudica. They resemble action potentials slowed down by a factor of a thousand or more. I have re-considered the 1920’s discovery of mitogenetic radiation by Alexander and Lydia Gurwitsch[1] in the ultra-violet, in the context of the fractality of frequencies in coherent systems, which I have discussed in my Chapters on “Homeopathy – How it works and how it is done”[2].
2. The Gurwitsch Onion Experiment
Gurwitsch postulated that some cells must be emitting light which could regulate the rate of division of other cells. To confirm this, he positioned the roots of two onions perpendicularly and established that there was a relative increase in cells on the side of the root which would have received the radiation. The effect was blocked by interposing a piece of glass but not by a piece of quartz which transmits in the ultra-violet.
I have found that plants seem to have the equivalent of an acupuncture meridian, linking leaf and stem nodes, root branches and root tips. The root tip is where the Gurwitsches found mitogenetic radiation coming from. As described in Appendix 2, I thought that there ought to be lower frequency fractals in addition to the ultra-violet.
To investigate this possibility, a bunch of spring onions from a local supermarket was placed in water for 3 hours to encourage growth and then their low frequency fractals were measured. They were also checked for the presence of ultra-violet by first covering the roots with a piece of glass (polished borosilicate) and then with a piece of quartz (polished fused silica); Table 1 compares the results.
Radiation from two of the onions from the bunch was transmitted through glass. Radiation from eight onions was transmitted through quartz but not through glass which is what Gurwitsch found, but radiation from two onions was not transmitted through either glass or quartz but only through air so it must have been radiating in the far ultra-violet. The optical to ELF frequency ratios at the glass and quartz limits are in good agreement (6.14 & 6.17×10¹³). The corresponding ratio for light irradiated water (Appendix 2, Table 1) is 8.25×10¹³, but this is for optical radiation imprinted into coherent domains in water, not coherence domains in living cells. Thus, it must be concluded that plantcells can emit radiation well into the ultra-violet and this opens up interesting photochemistry possibilities for living systems.
Table 1
Onion Roots: ELF and Optical Effects Compared
|
Onions – ELF (Hz) |
Optical to ELF Frequency Ratios |
|
|
Transmitted through |
12 |
|
|
air, glass and quartz |
13 |
|
|
Glass transmission limit 350 nm. 0.86×10¹⁵ Hz |
6.14×10¹³ |
|
|
Transmitted |
15 |
|
|
through |
16 |
|
|
air and |
17 |
|
|
quartz |
18 |
|
|
but |
21 |
|
|
Not |
23 |
|
|
through |
24 |
|
|
Glass |
25 |
|
|
Quartz transmission limit 180 nm 1.67×10¹⁵ Hz |
6.19×10¹³ |
|
|
Transmitted through |
28 |
|
|
air but not glass or quartz |
32 |
To investigate the effect of a homeopathic potency on this radiation, the onion with an ELF of 17 Hz was selected. A tablet of Phosphorous in the 6C potency which entrains a Poinsettia to 50.01 Hz was placed on the onion roots. Within a second, there was no longer any transmission through the quartz. Scaling upwards from the ELF frequency for these roots the potency should have moved the radiation up to 90 nm, which corresponds to 11eV or 988 kJ/mol. This should not break up coherence domains as it is still below the 13.6eV ionization potential for water and the 12.06eV water line considered by Del Giudice and Preparata as responsible for the coherence domains in water which determine some of its basic physical properties.
Since the photon energy ratios are of the order of 1013, any effect at this speed must be a quantum coherence effect and not a classical energy build-up from many low energy quanta. Energy would be supplied when the coherence is set up in the first place.
3. Poinsettia
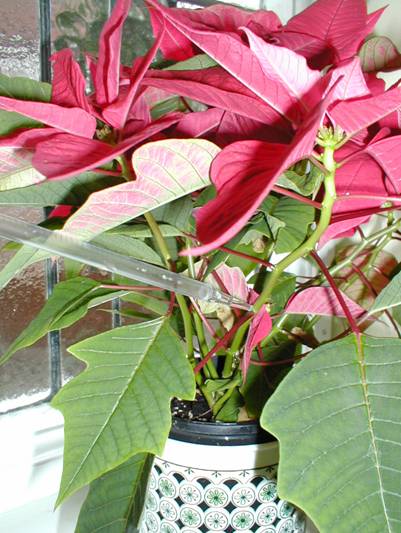
The meridian frequencies in a Poinsettia were imprinted into water in a pipette at a leaf node by bringing a strong bar magnet up close to the pipette tip (Figure 1). A pill of Sulphur 30C was then placed on the surface of the soil. This entrained the meridian frequency from its endogenous value to the nearest frequency of the Sulphur 30C potency. This was repeated on three plants as shown in Table 2. The meridian frequency returned to near its original value as soon as the potency was removed. A pill of this same potency was “erased” by briefly shielding it from the geomagnetic field in a steel box. This “erased” homeopathic pill had no effect on the meridian frequency when placed on the surface of the soil.
Figure 1
Poinsettia showing Meridian Frequency Imprinting into a Pipette

Table 2.
Frequency Entrainment by a Homeopathic Potency
|
Frequencies in Hz |
Poinsettia #1 |
Poinsettia #2 |
Poinsettia #3 |
|
Initial frequency |
3.016 |
3.123 |
3.142 |
|
With Sulphur 30C |
0.3222 |
0.3222 |
0.3222 |
|
Pill removed |
3.112 |
3.117 |
3.121 |
Table 3 shows the three frequencies measured from a leaf node of a poinsettia. These plant meridian frequencies are highly coherent but, less so than the theoretical and experimental bandwidths for a frequency imprinted into water. The response to the homeopathic potency was instantaneous not 3.8 minutes as in Table 3 so this was not a classical effect.
Table 3
Meridian Frequencies and Bandwidths for a Poinsettia.
|
Upper Frequency |
Lower Frequency |
Bandwidth |
Fractional Bandwidth |
Time Constant for Classical System |
|
170.69 mHz |
170.46 mHz |
0.23 mHz |
1350 ppm |
11.6 min |
|
3.2515 Hz |
3.2508 Hz |
0.70 mHz |
215 ppm |
3.8 min |
|
43.263 Hz |
43.257 Hz |
6.0 mHz |
139 ppm |
26.5 sec |
Table 4 extends the measurements in Table 2 to many of the homeopathic potencies discussed in the December 2008 issue of hpathy.com (i.e. as many as the writer had available). They are not necessarily the potencies recommended in the articles, but in general the higher potencies will contain higher frequencies in addition to those of the lower potencies. Only the lowest frequency fractal on the Poinsettia meridian was investigated, in order to demonstrate the phenomenon of entrainment.
The combination of CarboVeg. and Nux vomica giving 7.8 Hz is quite remarkable. This is the endogenous frequency of the heart meridian and is also a frequency of the Schumann Radiation from the upper atmosphere under which life has evolved. If it also decontaminates water, this is an added gift from Nature.
Table 4
Frequency Entrainment of the Poinsettia Meridian by Homeopathic Potencies
Apis
|
Homeopathic Remedy |
Recommendations[3] |
Potency |
Frequency (Hz) |
|
Poinsettia’s Endogenous Frequency |
3.113 |
||
| For very thin plants due to high production, varieties with low heat tolerance, low fertility of pollen, falling off of flowers and fruits. |
6C |
0.4037 |
|
|
Arnica |
For plants in mild climates (cold climate) during heat periods, after elimination of buds, after crops which have damaged branches. (Always when there is a mechanical damage of tissues.) |
6C |
1.315 |
|
Calcarea carbonica |
For plants not responding to fertilization, of slow growth, necrosis on the border of leaves. |
30C |
21.45 |
|
Calcarea fluorica |
For plants not responding to fertilization, of slow growth, necrosis on the border of leaves. |
6C |
14.42 |
|
Calcarea phosphorica |
For plants not responding to fertilization, of slow growth, necrosis on the border of leaves. Hydric stress, apical decay in fruits, acute sensibility after high production. |
30C |
20.02 |
|
Carbo vegetabilis |
For use after attacks of defoliating insects, water deficiency, change of temperature, flowers falling off, bud death, plants in compact soil. To reactivate bio-fertilizers in a balanced form. |
6C |
33.12 |
|
Chamomilla |
For slowly growing plants, attacks of mildew and other fungi. Rachitic plants. Interruptions of growth. Delay in production. |
30C |
1.227 |
|
Cina |
To control nematodes, plagues and bacteria. |
6C |
64.17 |
|
Nux vomica |
For plants intoxicated by agro-chemicals. |
200C |
0.5000 |
|
Phosphorous |
Affects zinc and boron levels. |
6C |
50.01 |
|
Silicea |
For slowly growing plants, attacks of mildew and other fungi. Rachitic plants. Interruptions of growth. Delay in production. |
6C |
3.617 |
|
Staphisagria |
Attacks of plant louses (aphids), nematodes or mites (acarians), for plants with excess of shadow. |
30C |
7.612 |
|
Sulphur |
Excess transpiration, for plants demanding fertilizers. |
30C |
0.3222 |
|
Carbo veg + Nux vom |
Carbo veg together with Nux vom decontaminate water. |
6C 6X |
7.801 |
Table 5
Combination Law for Frequencies
|
Frequencies Hz |
Carbo veg. |
Nux vom |
|
|
1.522×10⁻³ |
5.000×10⁻¹ |
|
¯ |
1.901×10⁻¹ |
2.500×10+1 |
|
|
3.312×10+1 |
2.500×10+3 |
|
Effective Frequency |
5.712×10⁻¹ |
7.313×10⁻¹ |
|
Combined Frequencies |
7.801×10 0 |
|
In my Chapters on”Homeopathy – How it works and how it is done”2, the frequencies in potencies are seen to follow a power law. The frequencies in Table 5 combine in a similar way. The product of the Carbo. veg. and Nux. vom. frequencies raised to the power of -2.352 gives 7.8 Hz. The frequencies for Carbo. veg. (up arrows divided by down arrows) raised to the power of 0.4215 gives the combined frequency. Similarly, for Nux. vom. with the power -0.080. At present these powers can only be determined empirically but they are what is measured when the potency is placed in a Caduceus coil.
4. Fertiliser
Chemicals that can hydrogen bond to water generate a characteristic frequency pattern. This applies to agricultural chemicals. As an example, the nitrogenous fertiliser, “EC Fertiliser Sulphate of Ammonia 20 (ammoniacal nitrogen 20.0%)” was selected. It was obtained from a garden centre.
The frequency pattern of the sulphate of ammonia powder and of a solution made up at the recommended liquid feed concentration of 30gm/9litres was used in these experiments with a Poinsettia plant. This chemical frequency pattern is shown in Table 6.
Table 6
Frequencies of Sulphate of Ammonia both as Powder and at Liquid Feed Concentration.
= stimulatory (hyperactive); ¯ = depressive or stressful (hypoactive).
Frequencies are given in Hertz (Hz) in scientific notation.
|
Frequency |
|
3.502× 10⁻³ |
|
¯5.853× 10⁻² |
|
6.743× 10⁻¹ |
|
¯9.131× 10 0 |
|
4.000× 10+1 |
4.1 In Glass Jar Placed on Soil
The endogenous frequency of the Poinsettia’s meridian measured at a leaf node was 3.115× 10⁻¹ Hz. Placing some of the sulphate of ammonia in a glass jar on the soil of the plant entrained the meridian to 6.743× 10⁻¹ Hz. The same happened when a glass jar containing a solution of sulphate of ammonia at liquid feed concentration was placed on the soil.
The liquid feed concentration regarded as a Mother Tincture was potentised[4]. The resulting frequencies are listed in Table 7. The initial frequencies of the liquid feed concentration sulphate of ammonia remained constant throughout and were as listed in Table 6. Only those frequencies added through potentisation are shown in Table 7. The higher fractal frequency on the Poinsettia meridian was 24 MHz. This remained unaltered up the C200 potency. The 1M potency entrained it to 30 MHz. All the lower potencies and the Mother Tincture had no effect on the 24 MHz fractal.
Table 7
Frequencies Added to those in Table 6 by Potentisations Shown.
= stimulatory (hyperactive); ¯ = depressive or stressful (hypoactive).
Frequencies are given in Hertz (Hz) in scientific notation.
| Potency | ||||||||
| C6 | ¯3.514× 10+2 | 4.516× 10+3 | ||||||
| C12 | ¯3.514× 10+2 | 4.516× 10+3 | ¯1.517× 10+4 | 7.0× 10+4 | ||||
| C200 | ¯3.514× 10+2 | 4.516× 10+3 | ¯1.517× 10+4 | 7.0× 10+4 | ¯2.80× 10+5 | 1.06× 10+6 | ||
| 1M | ¯3.514× 10+2 | 4.516× 10+3 | ¯1.517× 10+4 | 7.0× 10+4 | ¯2.80× 10+5 | 1.06× 10+6 | ¯4.1× 10+6 | 3.0× 10+7 |
4.2 Watered on to Soil
Finally, 20 ml of the liquid feed concentration sulphate of ammonia was watered onto the soil. This was compared with watering 20 ml of a copy of its chemical frequency signature on to the soil. In both cases, the endogenous frequency of the meridian immediately became exactly that listed in Table 6 indicating that the plant had taken note of the change in its nutritional environment and that this change was characteristic of a nitrogenous fertiliser.
Table 8 compares the subsequent frequency patterns on the meridian. At the half-hour point, the Poinsettia must be doing something with the liquid feed whereas with the imprinted water it is saying, “Have read the menu, where is the food?”.
Table 8
Frequencies on the Poinsettia Meridian Following Watering with 20 ml of Liquid Feed Sulphate of Ammonia and Frequencies Copied into Water.
= stimulatory (hyperactive); ¯ = depressive or stressful (hypoactive).
Frequencies are given in Hertz (Hz) in scientific notation.
|
Endogenous |
3.115× 10⁻¹ |
3.115× 10⁻¹ |
|
Hours |
Liquid Feed |
Imprinted Water |
|
0 |
As in Table 6 |
As in Table 6 |
|
½ |
5.411× 10⁻¹ ¯8.014× 10⁻¹ 5.534× 10⁻¹ |
3.413× 10⁻¹ |
|
1 |
3.313× 10⁻¹ |
3.115× 10⁻¹ |
|
1½ |
3.115× 10⁻¹ |
3.115× 10⁻¹ |
The conclusion from this experiment is that plants can quickly become aware of changes in their nutritional environment through chemical frequency signatures even though as in the case of the potencies, there was nothing but frequency imprinted water. This was inside a glass jar and not in direct contact with the soil. The watering of a nitrogenous fertiliser or a copy of its chemical frequency signature onto the soil also had an immediate effect. The meridian was entrained to these frequencies and this persisted for about an hour before the meridian returned to its normal endogenous frequency.
The measurement of frequencies on a plant meridian offers the possibility of rapidly assessing the status of a plant and its response to an applied stimulus.
5. Electrical Resistance Measurements on Plants
A paper written in the Summer of 1988 by the present writer and the student on whose project work it was based is given in Appendix 1. We never managed to get this work published. It shows that a chlorided-silver electrode inserted into the stem of a plant and the wound allowed to heal, provides a stable electrical contact over a long period. Measurements of the electrical resistance between such an electrode and an electrode inserted into the soil showed changes following ultra-violet illumination and also periodic diurnal changes. The latter persisted even when the plant was kept in darkness. They correlated with the fluctuations of the local geomagnetic field and could be provoked by exposure to an artificial magnetic field variation of the correct magnitude and rate of change. Our conclusion was that the plant could sense the arrival of sunlight in the ionosphere through the geomagnetic changes and prepare for photosynthesis as soon as dawn broke at sea level. This effect could be suppressed by keeping the plant in a strong magnetic field gradient so that it could not sense the geomagnetic changes. Leaving it there over a weekend nearly killed it.
Conclusions
This collection of miscellaneous experiments is intended to demonstrate the way that plants are making use of geomagnetic fields, and of frequencies covering much of the electromagnetic spectrum. If there was not a duality between the chemical bond and frequency, spectroscopic analysis would be impossible. Coherence makes frequency a fractal quantity linking the optical to the technological to the biological.
The frequency content of homeopathic potencies is able to entrain a plant’s meridian to the potency. The effects of some homeopathic potencies on plants are known. The next thing to find out is what bio-chemistry is switched on/off by these potencies and frequencies, remembering that because of frequency fractality, the possibility of photochemistry must be considered.
Referring to my title, “Plants may be slow but, they are not stupid!” the techniques described here enable one to make a rapid assessment of a plant’s status and intelligence about its environment without having to wait for some visible change in growth or habitat.
Appendix 1.
“Diurnal Periodicities in the Electrical Resistance Between Stem and Rooting Medium for Crassula and Dieffenbachia“
M.A. Britton and C.W. Smith,
Written in 1988 in the then Department of Electronic and Electrical Engineering of the University of Salford, England, but remaining unpublished.
Abstract
The resistance of plant stems can be conveniently measured using a conventional bridge circuit connected between a ground electrode inserted into the rooting medium and a chlorided-silver electrode inserted into the plant stem. Two plant species were chosen: Crassula argenta a succulent needing warm light and dry conditions and Dieffenbachia picta superba needing shady moist and warm conditions. Recordings of the stem resistance showed regular diurnal fluctuations both in normal daylight and when in the total darkness of an incubator. These fluctuations correlated with the natural local variations in the geomagnetic field but, they could be simulated by suitable laboratory generated magnetic fields. A phase lag of about 1½ hours was involved.